
Working with the Asian Development Bank (ADB), we supported the Ministry of Regional Development and Infrastructure in Georgia to inform coastal planning and resilient infrastructure design.
EO data played a central role in monitoring coastal change along Georgia’s Black Sea coastline, where long-term ground observations are limited. Landsat (USGS) and Sentinel-2 (Copernicus) imagery was used to map historical and present-day shoreline positions over several decades, enabling consistent assessment along nearly 300 km of coastline. This analysis identified where erosion or accretion are occurring and how these patterns vary between different coastal sections.
EO was also used to characterise key coastal hazard drivers, including waves and sea levels, using long-term reanalysis datasets from the Copernicus Marine Service and European Centre for Medium-Range Weather Forecasts (ECMWF). These datasets provided more than 40 years of hourly wave and sea-level information, enabling the assessment of extreme conditions and storm impacts. By combining EO-derived metocean data with shoreline change analysis, the project explored how storm events contribute to erosion and how short-term changes relate to longer-term coastal trends.
Crucially, EO data helped link coastal change to infrastructure risk and future climate impacts. Satellite-derived shoreline positions were combined with spatial data on road assets to identify exposure to erosion and flooding. EO-based sea-level trends and climate projections were then used to estimate future shoreline retreat and define erosion risk zones for 2050 and 2100, supporting targeted intervention and longer-term climate resilience planning.
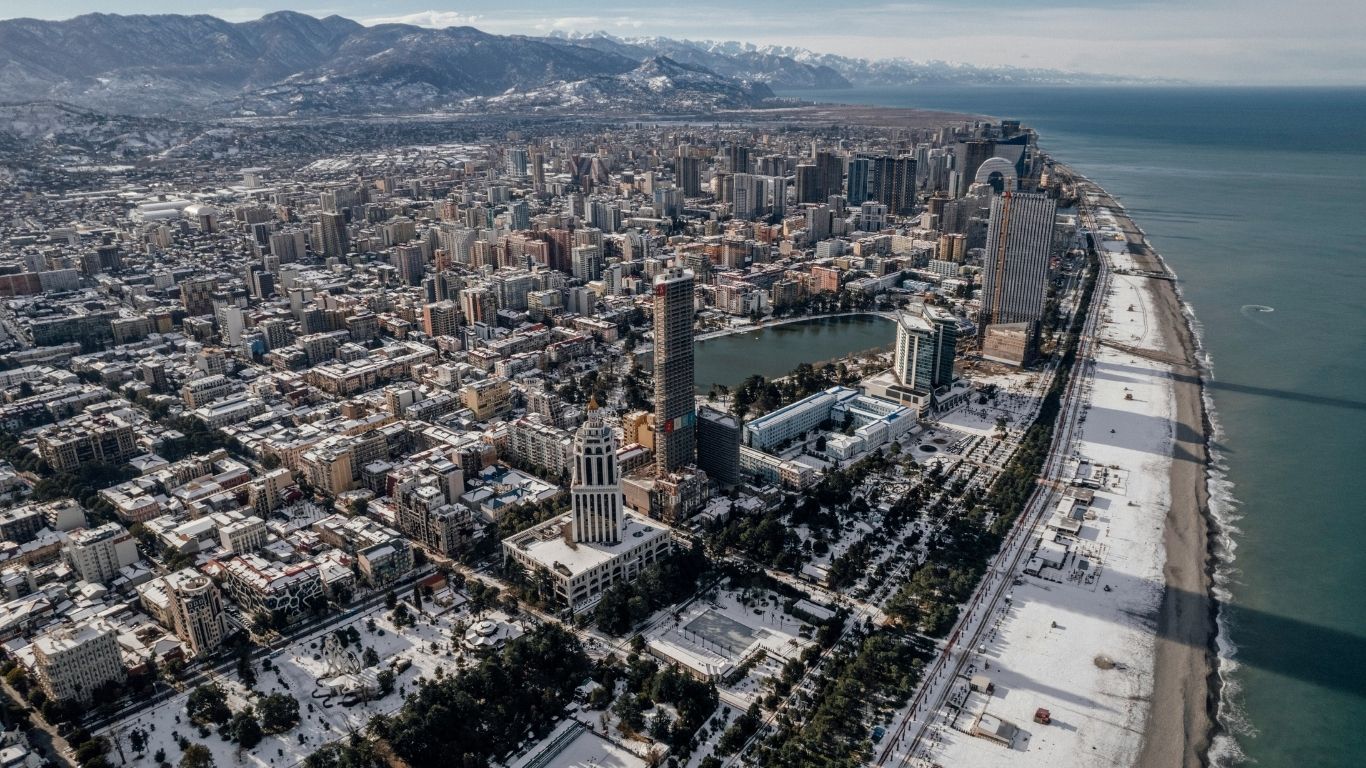
Aerial view of Batumi along Georgia’s Black Sea coast.
EO data was a key spatial component for assessing geomorphological processes and flood risk generation drivers affecting Dar es Salaam, where rapid urbanisation and limited long-term ground observations constrain traditional analysis approaches.
These datasets were integrated into a GIS-based erosion susceptibility model covering all catchments draining through Dar es Salaam. Vegetation indices derived from Sentinel-2 imagery were used as a proxy for soil stability, while satellite derived built up area data was used to capture the influence of impervious surfaces on runoff generation and sediment mobilisation.
By integrating EO datasets with topography, soil and rainfall, the catchment-wide assessment, provided a consistent and repeatable framework to identify, monitor and reassess erosion hotspots and sediment pathways contributing to flood risk in downstream urban river reaches. In the Lower Msimbazi River basin, a more detailed geomorphological assessment was supported by UAV-based imagery. This enabled detailed mapping of river channels, bank erosion, sediment deposition and post-flood morphological change within Dar es Salaam, helping prioritise interventions and establish a repeatable assessment framework.
Read more about this project: Sediment management, Dar es Salaam
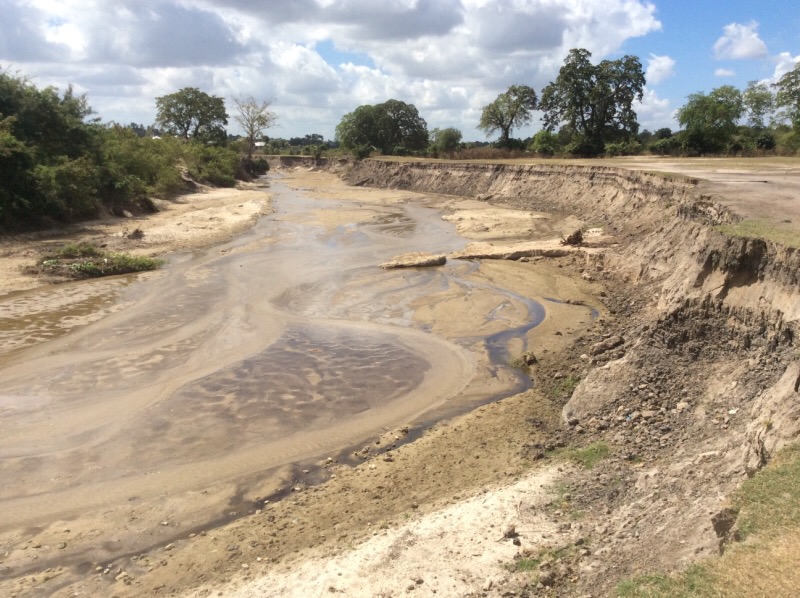
River bank erosion along the Msimbazi river, Tanzania.
We used EO-derived hydrological information to characterise the rainfall and catchment conditions driving climate variability, flood and landslides during Cyclone Freddy in southern Malawi, and understand the vulnerability of key structures.
Satellite rainfall products (from Climate Hazards Group InfraRed Precipitation with Station data (CHIRPS), Global Precipitation Measurement Mission (GPM) and PERSIANN – Dynamic Infrared Rain Rate near real-time (PDIR) were used to assess spatial rainfall patterns, multi-day accumulations and antecedent wetness. This enabled consistent regional-scale analysis of event duration, persistence and rainfall anomaly, which were key factors behind widespread flooding, debris flows and landslides. EO-derived digital elevation models (ALOS PALSAR) supported hydrological interpretation by defining drainage pathways, slopes and elevation patterns influencing runoff concentration in addition to helping to verify hydraulic modelling outputs.
EO was also central to providing rapid, repeatable post-event mapping across large and often inaccessible areas. 10m resolution optical imagery (Sentinel-2, supplemented by Landsat and radar imagery Sentinel-1 where cloud persisted) was used by our project partner, British Geological Survey, to map landslide and mudflows. These features were analysed alongside DEM-derived slope, geology and land use data to explore controls on landslide occurrence and channel instability. EO time-series imagery also supported assessment of channel widening, bank erosion, sediment deposition, and recovery – after each storm. Helping inform future susceptibility assessment and early warning system development
Read more about this project: Post cyclone recovery, Malawi
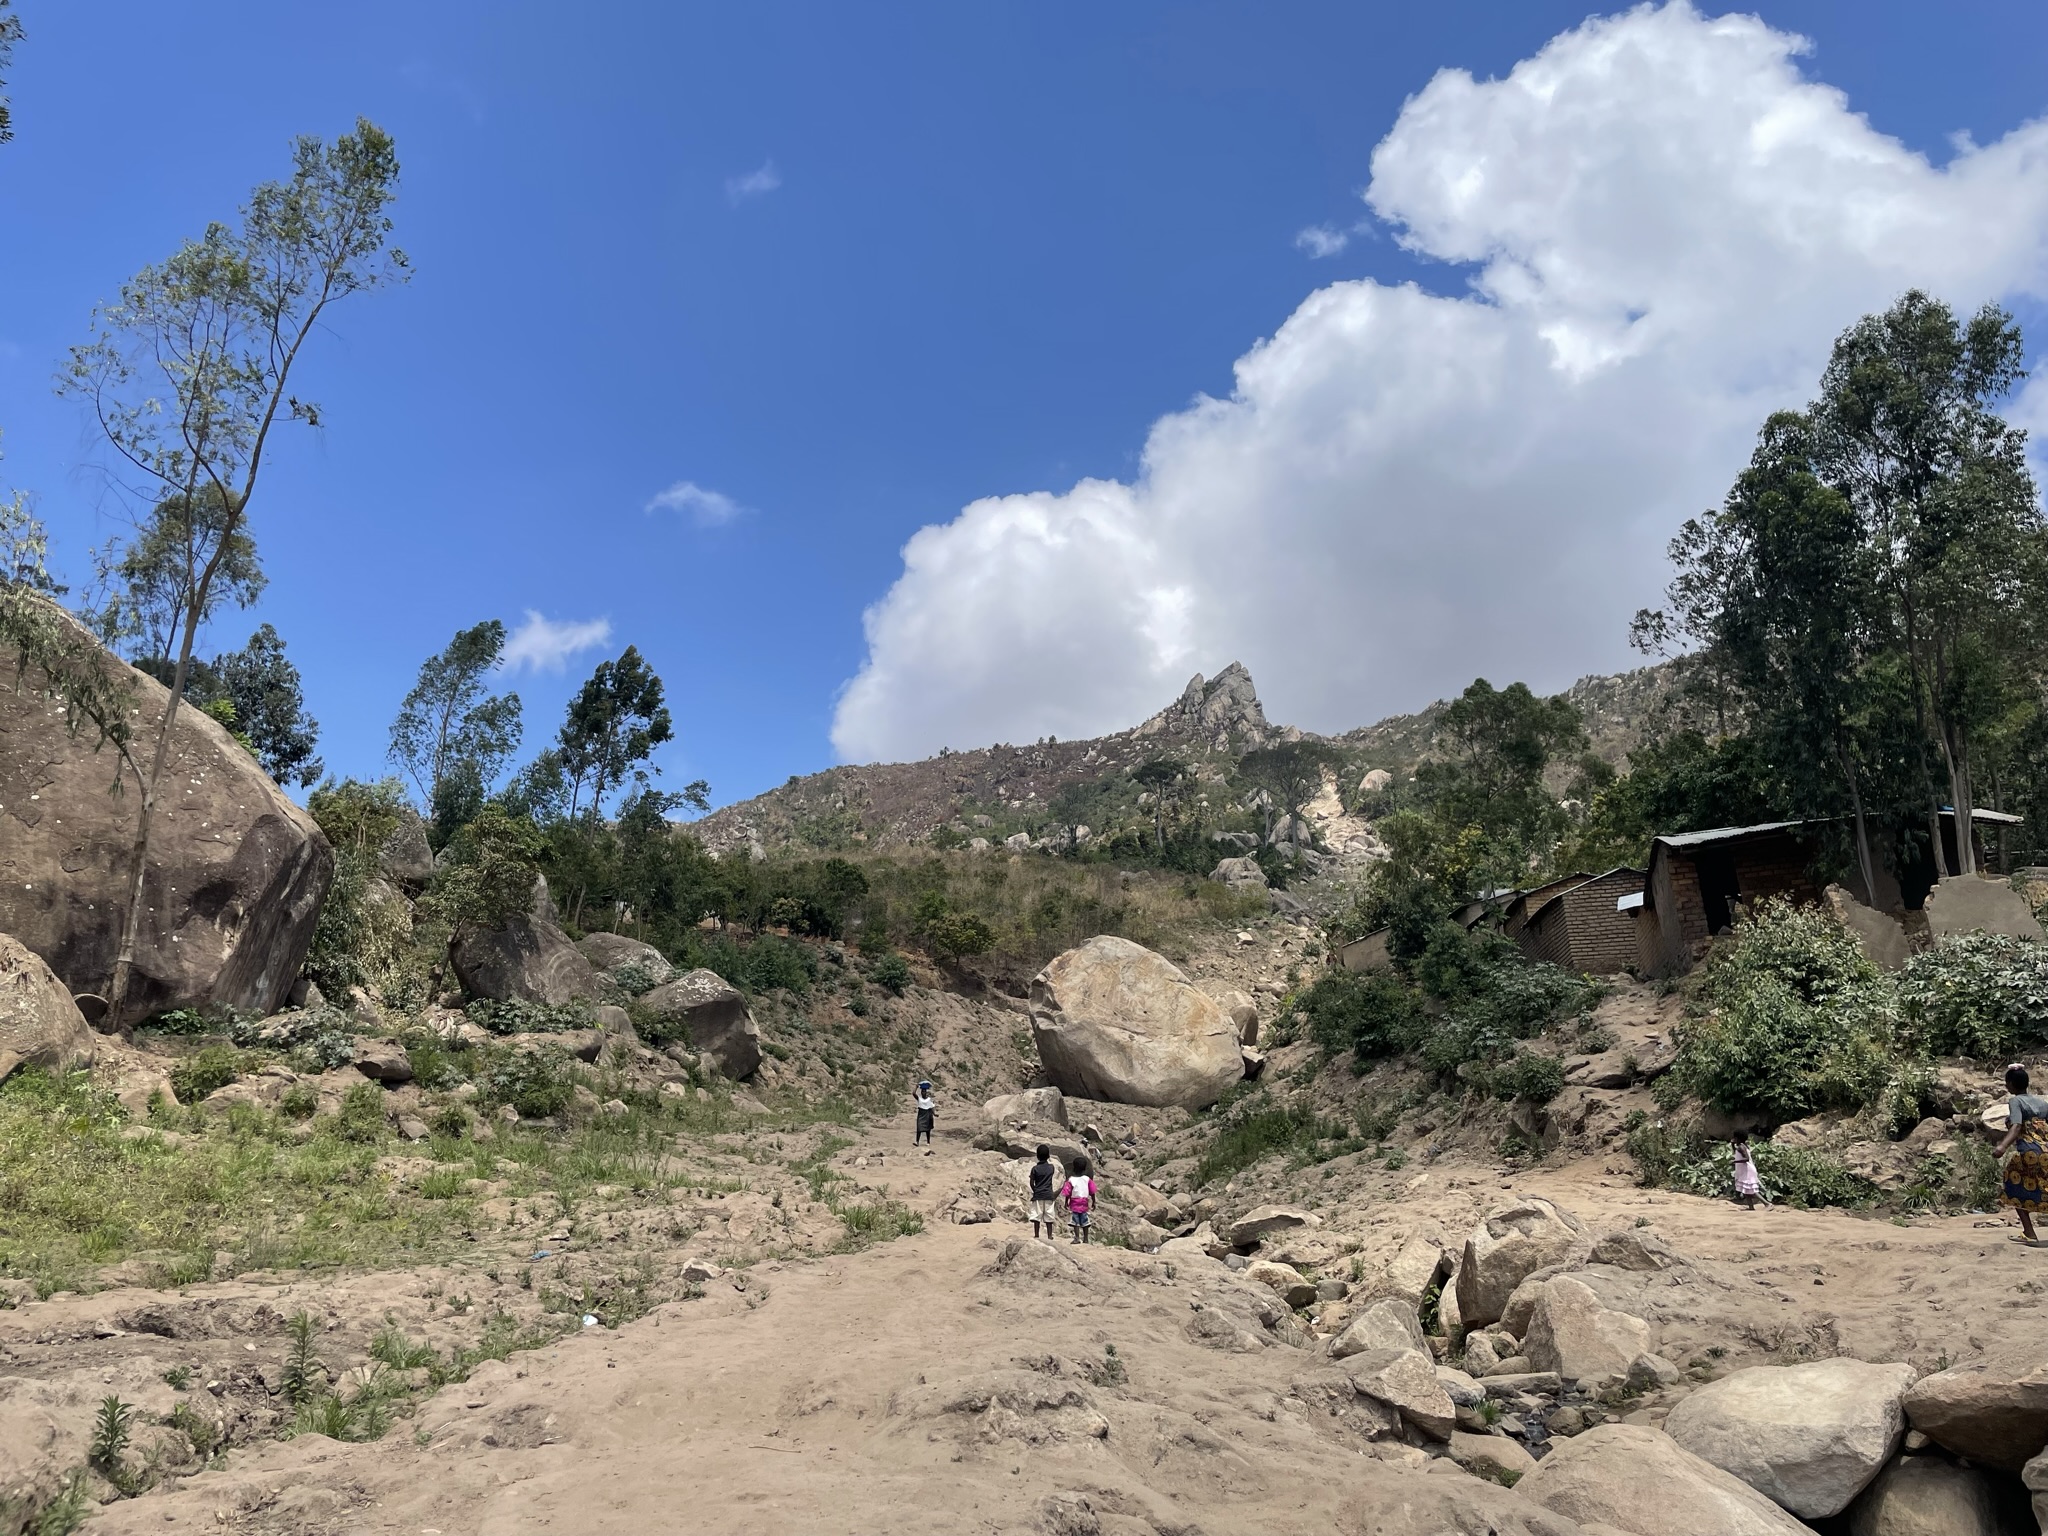
Flash flood pathway following Cyclone Freddie, Malawi